

I’m passionate about trading and technical analysis. Today, I want to share with you MACD, a key momentum indicator. It offers deep insights and trading chances, and I’m excited to reveal its secrets.
MACD has changed how traders view the markets. It shows trend strength and direction, helping us make better decisions. This guide will teach you how to use this indicator to its best.
Get ready to explore the MACD indicator. We’ll learn about its mechanics, history, and practical trading strategies. Let’s improve your trading skills with momentum trading.
Key Takeaways
- It is a powerful momentum indicator that helps traders identify trends, momentum shifts, and potential buy/sell signals.
- This guide will provide a comprehensive understanding of this indicator, including its components, how it measures market momentum, and how to interpret its histogram.
- We’ll explore the history and evolution of technical analysis, highlighting the importance of it in the field.
- Learn key elements of this indicator trading strategies, including signal line crossovers, zero line crossovers, and its divergence patterns.
- Discover how to combine it with other technical indicators to enhance your trading edge.
- Explore advanced techniques, such as multiple timeframe analysis, its settings optimization, and effective risk management.
- Gain insights into common trading mistakes and how to avoid them for more consistent and profitable trading.
The Foundation of Momentum Trading
The Moving Average Convergence Divergence indicator is a key tool for traders. It helps them use market momentum to their advantage. To fully understand , it’s important to know its parts and how it shows the market’s pulse.
The Components of This Indicator
It has three main parts:
- The MACD line, which shows the difference between the 12-period and 26-period moving averages.
- The signal line, a 9-period exponential moving average of the its line.
- The histogram, which shows the difference between the line and the signal line visually.
How It Measures Market Momentum
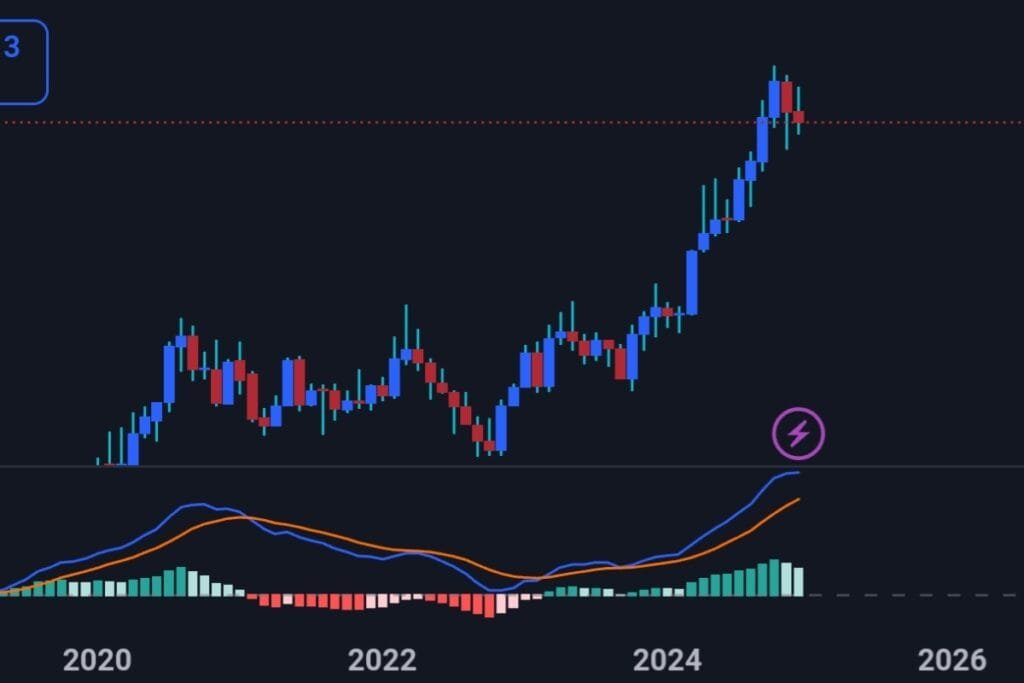
It is an oscillator that moves above and below a zero line. It gives insights into the market’s momentum. A MACD line above the zero line means a bullish trend. A line below the zero line means a bearish trend.
Reading Its Histogram
The MACD histogram helps spot overbought and oversold market conditions. Positive bars mean the MACD line is above the signal line, showing bullish momentum. Negative bars mean bearish momentum.
Understanding the this indicator’s components and how it works helps traders. They can then make better trading decisions based on the market’s momentum.
The History and Evolution of Technical Analysis with it
The Moving Average Convergence Divergence indicator started in the late 1970s. Gerald Appel created it. It has become key in trading strategies, adapting to the changing markets.
Appel’s MACD was a big step in technical analysis. It shows the difference between two moving averages. This gives traders a clear view of a security’s momentum.
As markets evolved, so did the its use. Traders now use it in complex strategies. It helps spot trend changes and potential reversals. The its flexibility keeps it valuable in technical analysis and trading strategy.
Now, the it is a must-have for many traders. It captures market momentum well. As markets get more complex, its importance will grow.
Key Elements for Trading Strategy
As a professional trader, I’ve learned that mastering its trading strategy is key. It helps identify buy/sell signals and confirm market trends. Let’s explore the core components of a strong MACD-based trading approach.
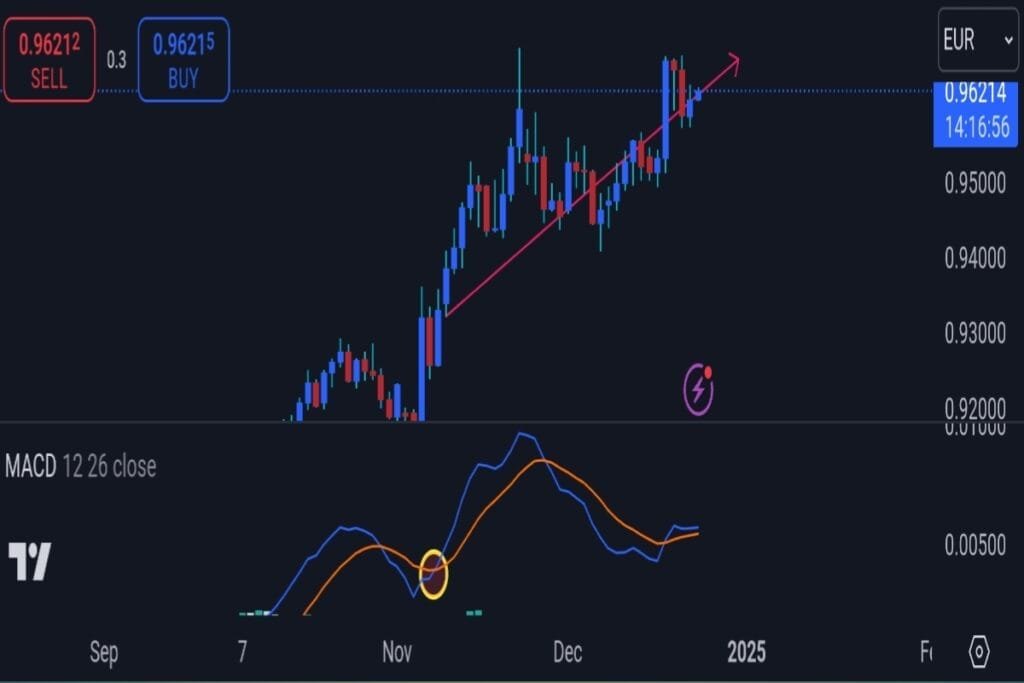
Signal Line Crossovers
One key its signal is when the MACD line crosses the signal line. A cross above can mean a buy signal, showing an upward trend. A cross below might signal a sell, hinting at a trend change.
Zero Line Crossovers
Watching zero line crossovers is also crucial. A cross above the zero line is bullish, showing momentum favoring the bulls. A cross below is bearish, hinting at a downward trend.
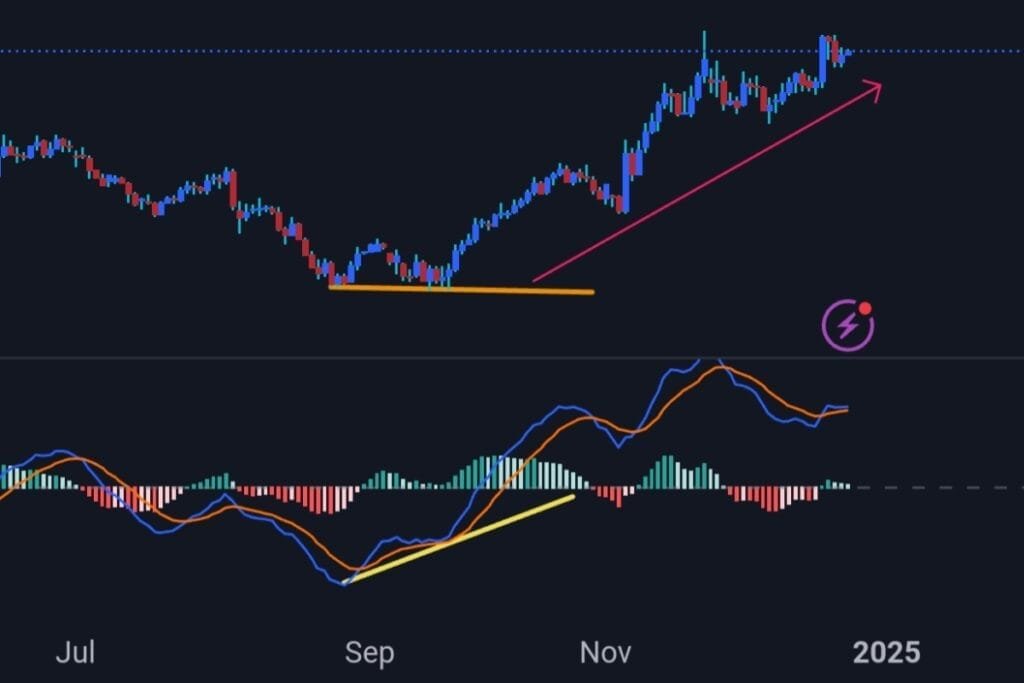
Its Divergence Patterns
Divergence patterns offer valuable insights. Bullish divergence, where the MACD line and price don’t align, can signal a trend reversal. Bearish divergence, on the other hand, may predict a downward trend.
Understanding strategy elements helps traders better identify buy/sell signals. It also aids in confirming trends and capitalizing on market shifts.
| MACD Signal | Interpretation | Potential Trading Action |
|---|---|---|
| MACD line crosses above signal line | Bullish signal, potential upward trend confirmation | Consider a buy opportunity |
| MACD line crosses below signal line | Bearish signal, potential downward trend reversal | Consider a sell opportunity |
| MACD line crosses above zero line | Bullish signal, momentum shifting in favor of the bulls | Consider a buy opportunity |
| MACD line crosses below zero line | Bearish signal, momentum shifting in favor of the bears | Consider a sell opportunity |
| Bullish divergence | MACD line makes higher lows while price makes lower lows, suggesting a potential trend reversal to the upside | Consider a buy opportunity |
| Bearish divergence | MACD line makes lower highs while price makes higher highs, suggesting a potential downward trend | Consider a sell opportunity |
Combining with Other Technical Indicators
As a seasoned trader, I’ve found that the best strategies use many tools. This indicator works well when paired with other indicators. This combination gives a clearer view of the market.
Integrating it with Trend-Following Indicators
Pairing it with trend-following indicators like RSI is powerful. It helps traders see the trend’s direction and momentum. This way, they can better decide when to buy or sell.
Utilizing it alongside Oscillators
Oscillators, such as the Stochastic Oscillator, work well with it. They show when the market is overbought or oversold. This helps traders time their trades better.
Incorporating Volume Indicators
Volume is key in technical analysis. Adding volume indicators like OBV or A/D to MACD is helpful. It shows the strength and lasting power of trends.
Using it with other tools makes trading strategies stronger. It helps traders understand the market better. This leads to better decisions and outcomes.
Advanced Trading Techniques
If you’re an experienced trader, you know the basics of the this indicator. It helps spot momentum and gives buy/sell signals. Now, it’s time to learn advanced techniques to get deeper insights and better manage risks.
Multiple Timeframe Analysis
One advanced method is using MACD on different time frames. Look at the daily, weekly, and monthly charts. This confirms the trend and momentum. It helps you make better decisions and avoid short-term traps.
MACD Settings Optimization
Adjusting your MACD settings can also be beneficial. The standard 12-26-9 settings might not always work. Try changing the EMA lengths or signal line period to improve the indicator’s performance for your trading style.
Risk Management with MACD
Using MACD for risk management is key to success. Look for divergence patterns to spot market reversals and adjust your trades. Also, use MACD zero line crossovers to set stops and protect your profits as the market moves.
By learning these advanced MACD techniques, you’ll trade more accurately. You’ll catch momentum trends and manage risks better. Add these strategies to your trading arsenal and see how MACD can boost your performance.
Common MACD Trading Mistakes to Avoid
I love technical analysis, and the MACD indicator is a powerful tool for spotting market trends. But, like any tool, it can be used wrong and lead to big losses. Here, I’ll share some common mistakes traders make when using MACD.
One big mistake is relying too much on it without looking at other indicators or the market.
It is great, but it’s not the only thing you should look at. Good traders use it with other tools to get a full picture of the market.
Another mistake is not understanding its signals in markets that aren’t moving much. In these markets, it can give false signals, causing traders to make quick, wrong moves. Smart traders know how to handle these situations better.
- Overreliance on it without considering other factors
- Misinterpreting it signals in ranging markets
- Failure to account for market context and broader technical analysis
To avoid these mistakes, it’s key to use a balanced approach to technical analysis. Add it to your tools, but don’t forget about other indicators, market trends, and economic news. By knowing how to use it and other tools, you can make better trading decisions and do better overall.
| Common MACD Trading Mistakes | Implications | Solutions |
|---|---|---|
| Overreliance on it without considering other factors | Potential for poor decision-making and missed opportunities | Use it in conjunction with other technical indicators and market analysis |
| Misinterpreting its signals in ranging markets | Increased risk of whipsaws and erratic trading | Recognize the limitations of it in sideways or consolidating markets |
| Failure to account for market context and broader technical analysis | Suboptimal trading decisions and missed market insights | Maintain a well-rounded approach to technical analysis and market understanding |
Conclusion
As we wrap up our guide to this, you now know its power and versatility. This momentum indicator has changed how we analyze markets. It helps traders spot trends, understand momentum, and make smart choices.
We’ve looked at Its details, from its basics to advanced uses. We’ve seen how its signals and patterns give us market insights. Using it with other indicators can give even more information, helping traders improve their strategies.
Remember, It is just one tool in your trading kit. Using it with good risk management and learning will help you trade better. I’m looking forward to seeing how you use these strategies to succeed in trading.
FAQ
What is MACD and how does it work?
It stands for Moving Average Convergence Divergence. It’s a tool used in technical analysis. It shows the momentum and direction of a market’s trend.
It’s calculated by subtracting a 26-period Exponential Moving Average (EMA) from a 12-period EMA. Then, the MACD line is plotted against a 9-period EMA signal line. This gives us buy, sell, and trend signals.
How can I interpret the MACD histogram?
It shows the difference between the MACD line and the signal line. When it’s above the zero line, it means positive momentum. Below the zero line, it signals negative momentum.
The height of the histogram shows the strength of the momentum.
What are the key MACD trading signals to look for?
Key signals include: – When the MACD line crosses above the signal line (a bullish crossover) – When it crosses below (a bearish crossover) – When it crosses the zero line (a zero-line crossover) – When the MACD line and price diverge (a bullish or bearish divergence)
How can I use MACD in combination with other technical indicators?
You can use it with other technical indicators to improve your trading strategy. Some good combinations are: – Using it with trend-following indicators like moving averages or the ADX – Pairing it with oscillators like the RSI or Stochastic to spot overbought/oversold conditions – Adding it with volume indicators to confirm momentum and trend strength
What are some common MACD trading mistakes to avoid?
Common mistakes include: – Relying too much on this without looking at other market factors – Misreading signals in ranging or choppy markets – Not adjusting its settings for different assets or market conditions – Not managing risk well when using this indicator.